Making Connections: More Options Diversify Travel Plans
← Back
World Cup Travel Data Shows Longer Car Rentals and More One-Ways
June 23, 2026
· By Hannes Poldvee, Car Rental Gateway
· Rental Operations
The FIFA World Cup 2026 is already starting to appear in car rental booking data.
At Car Rental Gateway, we recently analyzed thousands of bookings across the 16 FIFA World Cup 2026 group-stage host cities. The analysis compared rental pickup dates around each city’s first hosted match with the same weekdays one year earlier.
Across those host cities, car rental pickups were up 40.6% around match day. That headline number matters, but it is not the whole story.
For rental operators, brokers and mobility platforms, the more useful insight may be how differently the impact appears from city to city, and how customers seem to be shaping their trips around the tournament.
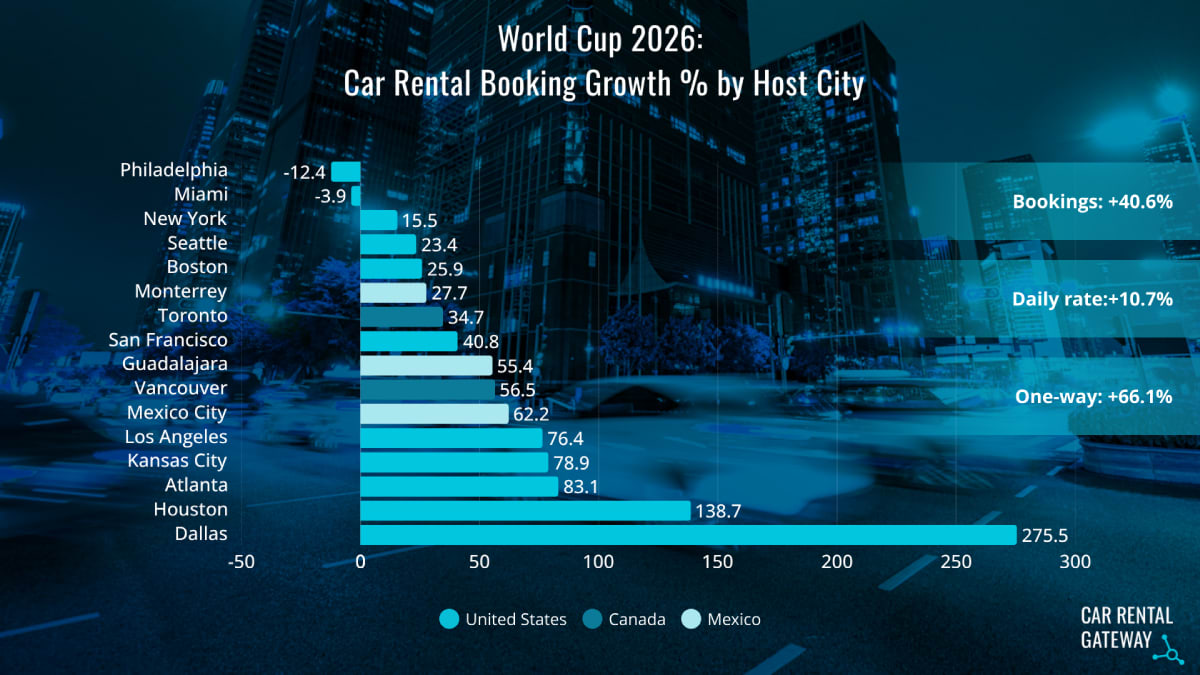
Canada was one of the more interesting regional signals. Vancouver saw pickups increase 56.5%, while Toronto was up 34.7%.
Those increases are not the largest in the dataset, but they are still useful because of the timing.
Canada’s first host-city matches came in mid-June, before the strongest July and August tourism period. That makes the lift easier to see against the seasonal baseline and suggests the tournament is already visible in rental pickup behavior.
Mexico also showed clear growth. Mexico City was up 62.2%, Guadalajara was up 55.4%, and Monterrey was up 27.7%.
The U.S. picture was more mixed. Dallas was one of the strongest movers, with bookings up 275.5%. That percentage should be read with some care because the prior-year base was smaller than in the largest U.S. hubs. Still, the increase is notable, especially when viewed alongside Dallas’ strong early group-stage fixture mix, including matches involving the Netherlands, England, and Argentina.
Fixture strength appears to matter. New York (NY NJ Stadium) opened with Brazil vs Morocco and saw pickups rise 15.5%. Philadelphia opened with Côte d’Ivoire vs Ecuador and was down 12.4% in the data.
That does not mean the team draw explains the full difference between the two locations, but it does suggest that the teams, fanbases, and host-city profile can shape how strongly a major event appears in rental demand.
One of the most interesting findings was not simply that more people rented cars. It was how they used them.
Across the 16 host cities, average rental duration rose 18.9%, while one-way bookings increased 66.1%.
That points to a different type of tournament travel. Some customers may not be flying into one city, watching one match, and returning from the same location. They may be picking up a car in one location, following the tournament, visiting other destinations, and returning the vehicle somewhere else.
For rental operators, that has practical implications:
- Major events can affect fleet demand before, during, and after match day.
- One-way bookings can create vehicle imbalance between locations.
- Longer rentals can reduce vehicle availability during peak windows.
- Demand can also vary widely depending on the teams playing, the size of the fanbase, local transport options and the existing tourism season.
Price growth was more moderate than pickup growth. Across the host cities, the average daily rate rose 10.7%. Some markets saw larger increases, but because vehicle mix can influence average daily rates, the change should not be viewed solely as demand pressure.
The main takeaway is that large sports events do not create one clean demand pattern across every host city. The World Cup appears to be shaping rental behavior in different ways by market.
Tickets, hotels, and flights often dominate major-event planning. Car rental data adds another perspective by showing how travelers move after they arrive.